

New Zealand was well known in the early years of the Covid-19 pandemic for having few related deaths while other countries suffered heavy loss of life. Some thought that there would be a ‘catch up’ so that total excess deaths would end up similar to those in other countries. There wasn’t. New Zealand remains an outstanding example of saving lives.
Previous posts have shown that Covid-19 affected mortality in Aotearoa New Zealand in a uniquely benign way.
During the first two years of the pandemic, New Zealand’s mortality was extraordinarily light, especially compared to the experience of many other countries. New Zealand took action against Covid-19 early. Lockdowns and border management meant very little Covid or influenza was in the country.
- In 2020, mortality rates improved markedly from 2019 and there were negative excess deaths, that is, fewer deaths than expected.
- In 2021, there was a slight uptick in mortality rates, but mortality was still mostly better than before the pandemic.
- In 2022, borders were reopened and restrictions stepped back. At most older ages, mortality worsened, but not so far as to neutralise the previous two years of good experience. The long-term trend of mortality improvement at ages over 50 was not set off course. The 2022 experience seemed to have been a blip, not a trend.
What happened in 2023?
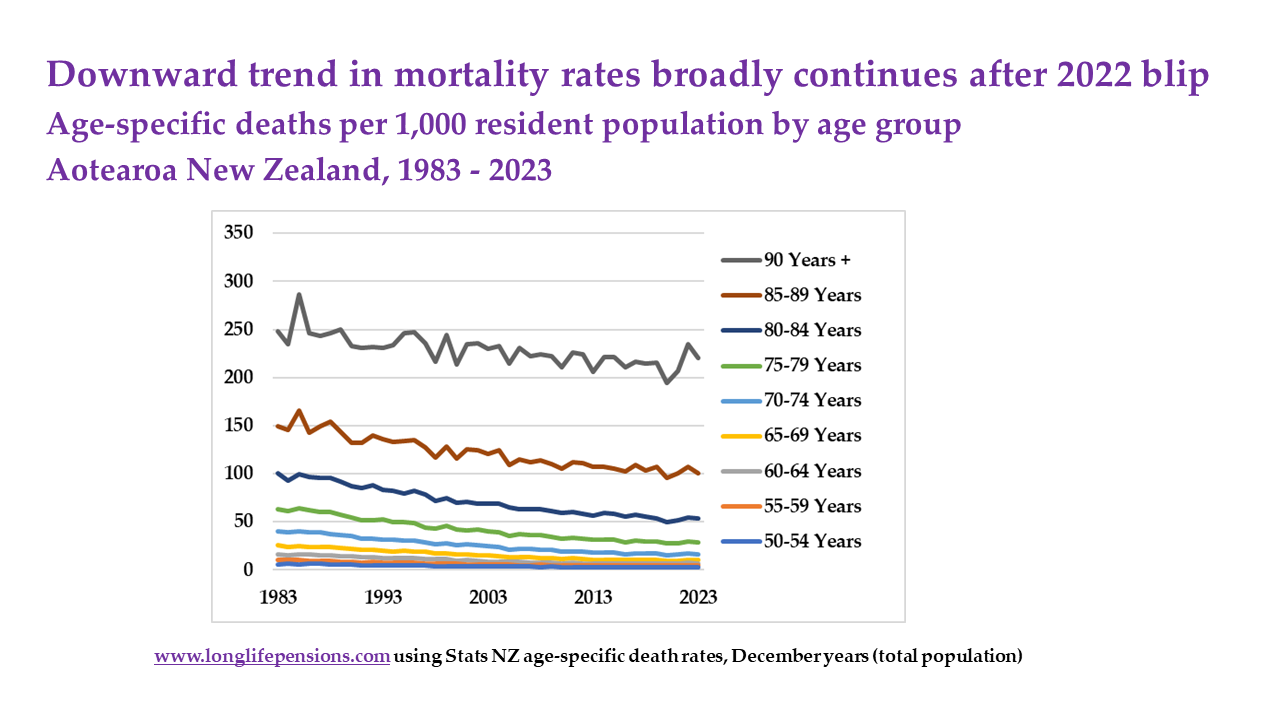
Death rates (also called mortality rates) count the number of deaths in a year at a specific age as a proportion of the number of people alive at that age. The history of death rates for the over-50s in New Zealand shows a steady fall, although there are fluctuations due to seasonal impacts and random variations.
Lower mortality rates means improvement. Fewer people die. People live longer.
The chart below of the recent history of death rates in New Zealand at older ages shows the downturn in 2020-21, the blip in 2022, and, at most ages, improvement in 2023. (Note only ages 50 and over are shown. The death rates at younger ages are too low to discern at this scale).
As in previous posts, it’s useful to index changes in death rates over time to a specific period. The index period chosen here is the average of 2015-17; before the pandemic and averaging over three years to smooth out any oddities in a single year. The choice of years is simply to compare experience before the pandemic to the pandemic years of 2020-23.
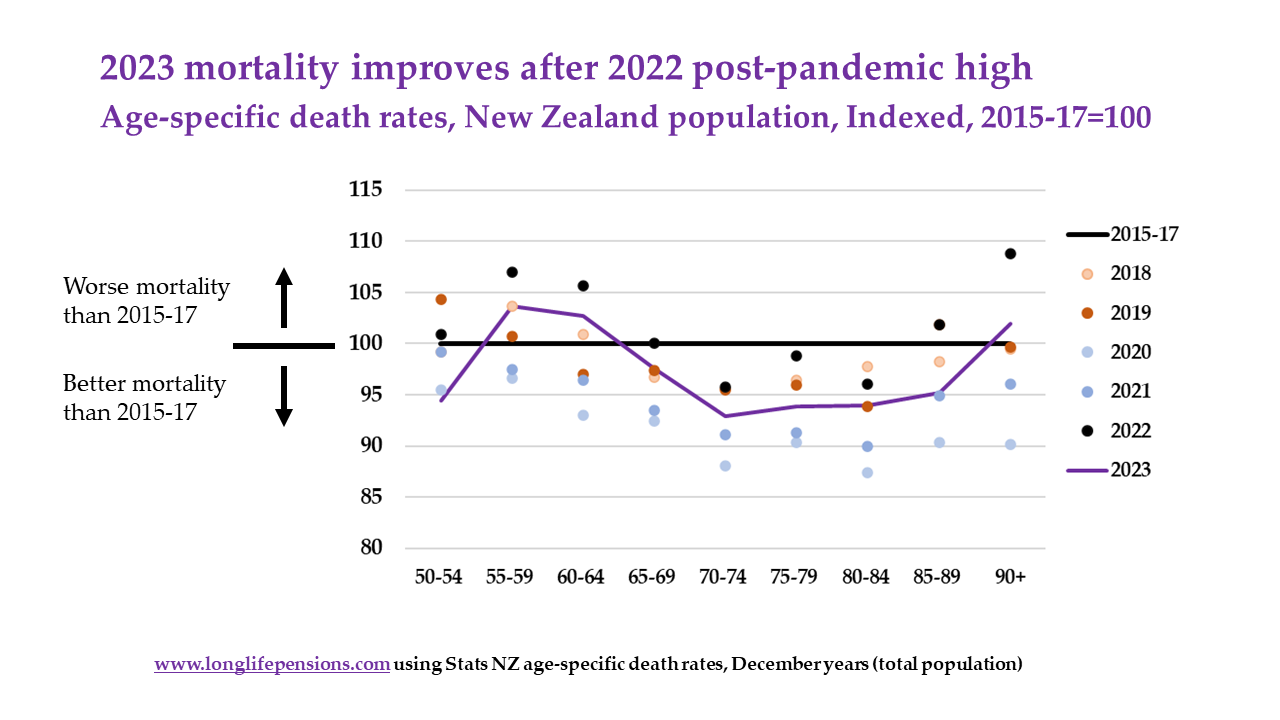
For all ages, the blue dots representing the 2020 and 2021 are below the index line, because death rates were better than in previous years. Some of the black dots for 2022 are above the index line, indicating worse mortality than 2015-17, and all are worse than 2020-21.
The improvement in 2023 is evident. The purple line is below the 2022 black dots for all ages, and below the 2015-17 index at most ages.
New Zealand’s top ranking on excess deaths
Taking the four years of the pandemic together, what was the cumulative New Zealand mortality experience?
To answer this, we can look at the number of “excess deaths” across the four years 2020-23. Excess deaths are the difference between deaths which have occurred over a period compared with how many deaths would have been expected with a continuation of normal mortality expectations without a pandemic.
Calculations of the number of excess deaths are approximations but they are still useful indicators, especially for cross-country comparisons. The excess deaths calculation does not require decisions on whether deaths were due to the pandemic or associated issues.
Excess deaths is an intuitively simple measure that neatly summarises the overall impact of the pandemic on life or death. It may be a technical calculation, but it tells a very human story of how many lives were lost.
In New Zealand, excess deaths were negative in 2020-21 meaning fewer deaths than expected. There were high excess deaths in most other countries. But is it possible that the pandemic simply accelerated death for older people in these countries, so that lower mortality in the next couple of years evened things out, whereas in New Zealand, deaths had to catch up in later years?
Our World in Data has been calculating excess deaths over the four years of the pandemic and the answer from their data is clearly – no. New Zealand’s cumulative excess deaths are internationally low.
The chart below shows the experience in selected countries of interesting comparison to New Zealand:
- In the UK and Sweden there were just too many excess deaths in the first year to ever be evened out.
- Denmark did not follow the European pattern of very high excess deaths in 2020, but excess deaths still increased later.
- Australia and New Zealand both benefited from early lockdowns, but Australia’s excess deaths then grew more significantly as New Zealand kept restrictions where needed until vaccination was widespread.
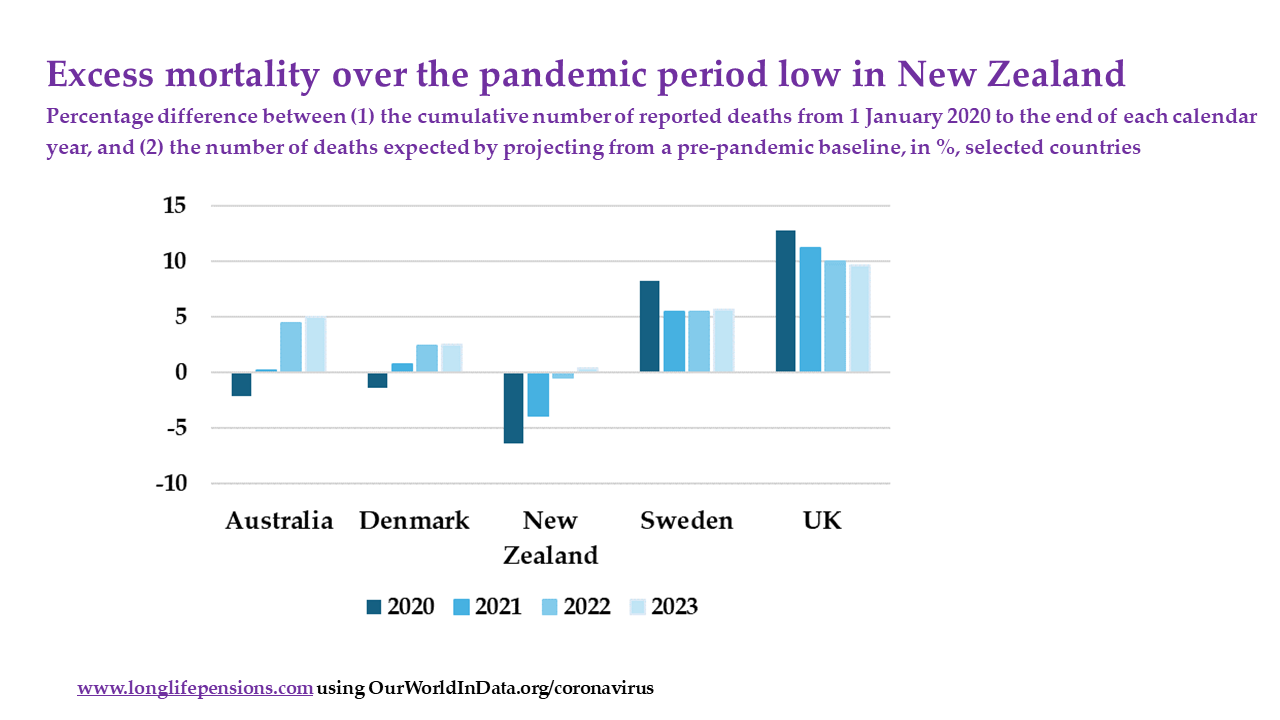
Compared to the mortality experiences in other countries, with significant counts of excess deaths and the horrendous experience of the first year, the four years of Covid-19 in Aotearoa New Zealand look remarkably benign. New Zealand remains an outstanding example of saving lives.
Looking ahead
Mortality trends are affected by more than pandemics, even one as significant as Covid-19. Excess mortality compared to a pre-pandemic baseline is less meaningful now than it has been. Analysts of mortality trends are turning their attention to how to scrutinise mortality from 2024 onwards. For example:
- Australian actuaries are considering whether to track future mortality compared to a “new normal” and if so, what that new normal is.
- Actuaries in the UK are no longer calculating weekly excess deaths compared to a pre-pandemic baseline but instead comparing weekly mortality rates to the ten-year average of 2014-2023, while highlighting that this average is not intended as a measure of likely or ‘normal’ deaths for 2024.
- The UK’s Office for National Statistics has been considering changing how it projects future mortality, with consequent new insights into longer term expectations.
New Zealand has always compared well internationally for low population mortality. As previous posts have shown, the translation of mortality trends into measures of how long people might live is best found in cohort life expectancy tables. StatsNZ has delayed an update to cohort life expectancy tables by a year as there is little change year-on-year to these measures which look over a lifetime.
Tracking of population mortality rates over short time periods remains important to understand seasonal and changing influences on health and mortality. Age-specific annual mortality rates remain the building blocks for projecting possible future mortality trends and lifespan expectations. Although New Zealand had less disruption to mortality trends than other countries during the pandemic years, future projections of mortality will need to consider how to take the effects of recent years into account.